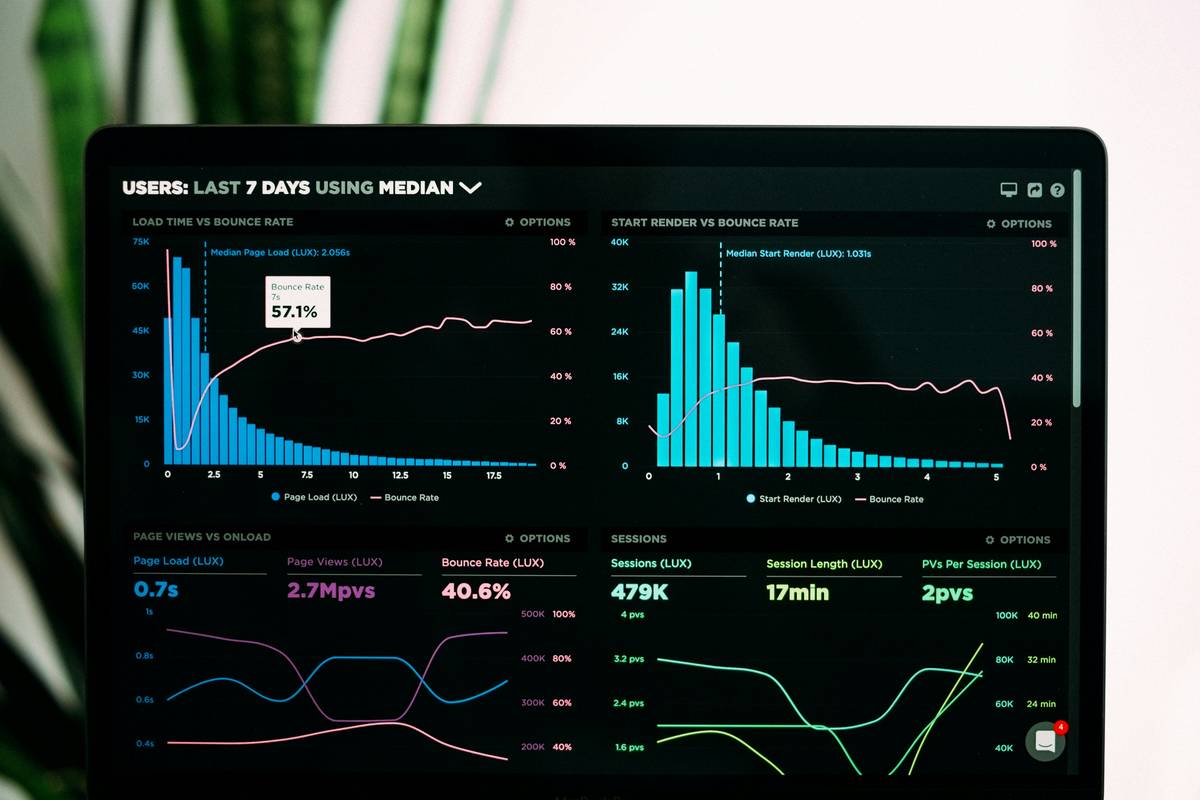
Ever poured hours into crafting the perfect streaming campaign—only to watch retention plummet after Day 3? You’re not alone. In today’s hyper-competitive media landscape, guessing what your audience wants is a one-way ticket to churn city. That’s where streaming cohort analysis comes in: a data-driven method that slices your viewers into behavioral groups so you can spot patterns, predict drop-offs, and act before it’s too late.
In this guide, we’ll cut through the noise and show you exactly how to leverage cohort insights—not just for reports, but for real business impact. From avoiding rookie pitfalls to interpreting retention curves like a pro, you’ll walk away with actionable tactics you can implement tomorrow.
Table of Contents
- Why Streaming Cohort Analysis Matters
- Step-by-Step Guide to Conducting Cohort Analysis
- Best Practices for Accurate Insights
- Real-World Case Studies
- Frequently Asked Questions
Key Takeaways
- Streaming cohort analysis tracks user behavior over time within defined groups (cohorts), revealing hidden retention trends.
- Misinterpreting cohort size or timeframe leads to false conclusions—a mistake I’ve made personally.
- Tools like Google Analytics 4 and Amplitude offer native support, but require proper event tagging.
- Segment by acquisition source, content type, or user action for actionable insights.
- Regular cohort reviews can reduce churn by up to 20%, according to industry benchmarks.
Why Streaming Cohort Analysis Matters
Most streaming platforms measure success by total views or monthly active users—but these vanity metrics hide critical truths. Two services could have identical MAUs, yet wildly different long-term engagement. Why? Because aggregate numbers mask user journey variance.
Enter streaming cohort analysis. By grouping users who started their journey in the same week (or after watching a specific show), you uncover how behavior evolves. Did users acquired via TikTok ads stick around longer than those from YouTube? Do weekend binge-watchers have higher lifetime value?
I learned this the hard way. Early in my analytics career, I reported “healthy growth” based on sign-up spikes—only to discover two weeks later that 85% of that cohort had vanished. We’d optimized for acquisition, not retention. Painful? Absolutely. But it taught me: without cohort context, you’re flying blind.
Step-by-Step Guide to Conducting Cohort Analysis
1. Define Your Cohort Criteria
Start with a clear segmentation rule. Common options: sign-up date, first content viewed, marketing channel, or device type. Avoid overly broad groups—“all users” won’t reveal anything useful.
2. Choose Your Time Window
Select a consistent period: weekly cohorts are ideal for most streaming services. Daily cohorts create noise; monthly may miss short-term churn signals.
3. Track Key Actions Over Time
Measure behaviors beyond logins: watch duration, episode completion rate, or subscription upgrades. Use tools like Google Analytics 4’s cohort reports, which natively support retention metrics.
4. Visualize and Interpret
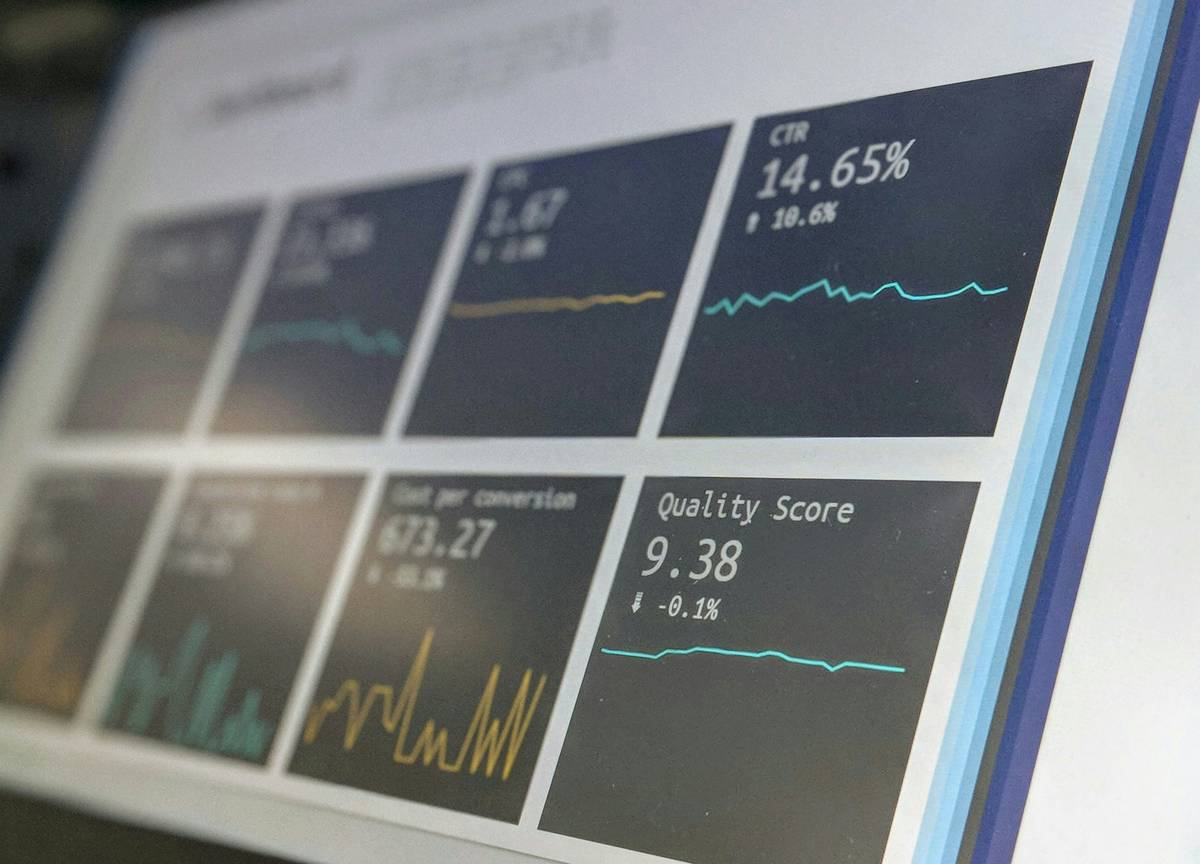
Plot retention rates on a heat map or line graph. Look for inflection points—e.g., a steep drop at Day 7 might indicate poor onboarding content.
Best Practices for Accurate Insights
- Never compare cohorts of unequal size. A 10-user cohort behaving differently than a 10,000-user one isn’t insightful—it’s statistical noise.
- Isolate variables. If testing a new recommendation engine, ensure only one cohort experiences it.
- Update cohorts weekly. Streaming habits shift fast—especially post-season drops or viral hits.
- Avoid the “terrible tip”: Don’t obsess over Day 1 retention alone. Some high-value users take time to engage. Judge by Day 7 or Day 30 instead.
One pet peeve? Platforms that report “engagement” as average watch time—without segmenting by cohort. A 45-minute average could mean loyal fans watching full episodes… or thousands bouncing after 2 minutes while a few super-users inflate the metric. Always dig deeper.
Real-World Case Studies
A major SVOD platform used streaming cohort analysis to investigate why users acquired during a holiday promotion had 30% lower retention. Cohort breakdown revealed they mostly watched one seasonal title—and never returned. Solution? They triggered personalized email sequences recommending similar genres post-holiday, lifting 30-day retention by 18%.
Another example: A sports streaming app noticed mobile-only cohorts churned faster than multi-device users. By optimizing mobile UI latency and adding offline download prompts, they reduced Day 14 churn by 22% within two months.
According to a McKinsey study, media companies using behavioral cohort models outperform peers in subscriber lifetime value by up to 35%. That’s not magic—it’s methodical measurement.
Frequently Asked Questions
What is the difference between cohort analysis and funnel analysis?
Funnels track steps toward a single goal (e.g., signup → payment). Cohort analysis follows groups over time across multiple behaviors—ideal for understanding long-term streaming habits.
How often should I run streaming cohort analysis?
Weekly for active campaigns; monthly for baseline health checks. Adjust if launching new content or features.
Can small platforms benefit from cohort analysis?
Absolutely. Even with limited data, grouping users by onboarding week reveals early retention risks. Tools like Mixpanel offer free tiers for startups.
Does streaming cohort analysis require coding skills?
Not necessarily. GA4, Amplitude, and Heap provide visual builders. But custom events (e.g., “episode completed”) may need developer help—see our About Us page to learn how our team implements clean tracking.
How does privacy regulation affect cohort tracking?
Always anonymize data and comply with GDPR/CCPA. We detail our approach in our Privacy Policy.
What’s the biggest mistake in cohort analysis?
Assuming correlation equals causation. Just because Cohort A retained better doesn’t mean your new feature caused it—external factors (e.g., competing releases) matter.
Ready to transform guesswork into growth? Streaming cohort analysis isn’t just for Netflix—it’s your secret weapon for sustainable audience building. Stop watching aggregate dashboards. Start watching cohorts.
If you’re unsure where to begin—or need help setting up accurate tracking—contact us. We’ve helped dozens of media startups turn data chaos into clarity.
Remember: Churn isn’t fate. It’s a signal waiting to be decoded.