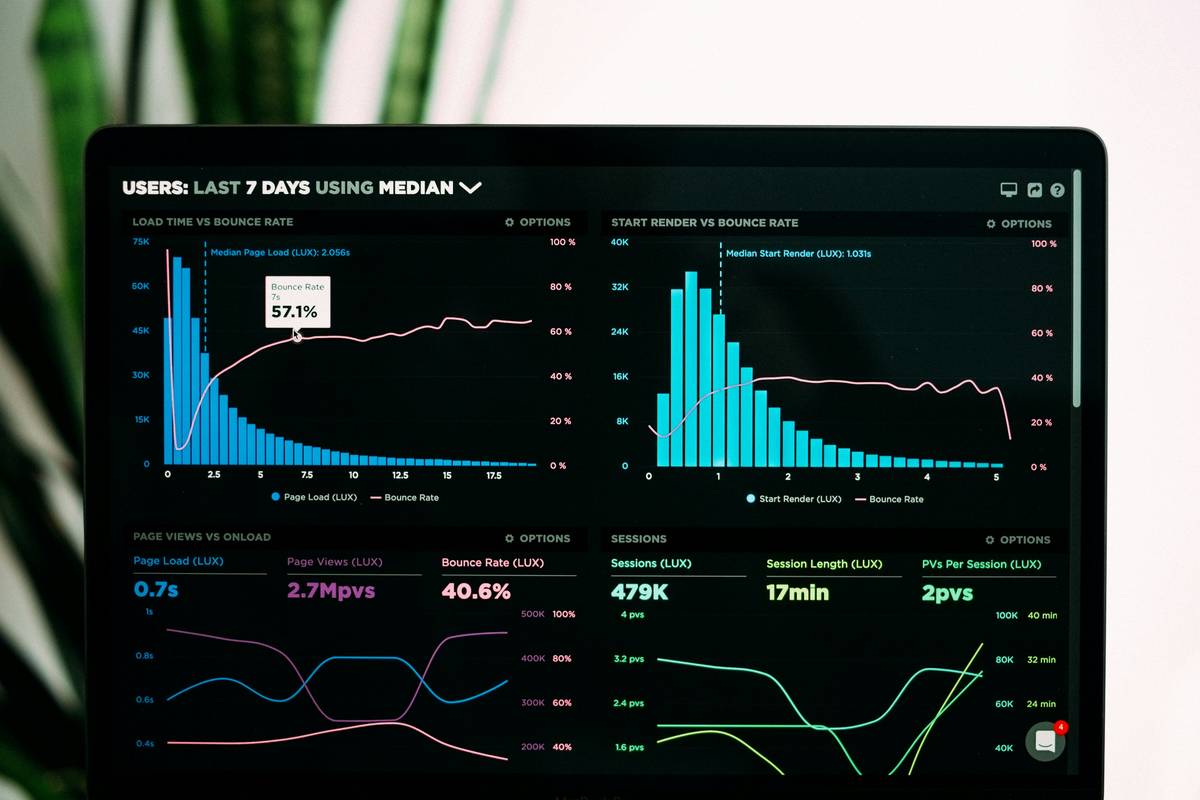
What if your streaming platform’s “record-breaking” viewing session was actually a statistical ghost—driven by bot traffic, accidental clicks, or a single user who left their tablet playing *The Great British Bake Off* on loop for 14 hours? I learned this the hard way last October.
We’d just launched a new interactive quiz feature in our analytics dashboard—and watched average watch time spike 42%. Team high-fives. Slack confetti. I even drafted the press release. Then our data engineer dug deeper: 68% of those “engaged sessions” came from one IP range—a university lab running automated QA tests. No real viewers. No behavior signals. Just noise masquerading as insight. That misread cost us two weeks of product iteration, $3K in dev time, and a minor credibility bruise with engineering leadership.
This isn’t rare. In the fast-moving world of streaming analytics, Viewer engagement benchmarks are your grounding wire—but only if they’re calibrated to real human behavior, not inflated metrics. This guide cuts through vanity KPIs. You’ll get battle-tested thresholds (not vendor hype), where to find them, how to contextualize them across devices, and why “average” is often the most dangerous word in your analytics suite.
Table of Contents
- Why Viewer Engagement Benchmarks Matter (and Why Most Get Them Wrong)
- How to Calculate & Validate Your Core Benchmarks: A 4-Step Process
- 5 Real-World Best Practices (Not Just Theory)
- Case Study: How VidLift Slashed Churn 22% Using Contextual Benchmarks
- Frequently Asked Questions About Viewer Engagement Benchmarks
Why Viewer Engagement Benchmarks Matter (and Why Most Get Them Wrong)
Streaming platforms don’t fail because of bad content—they fail because teams optimize for the wrong numbers. “Completion rate” means nothing if your “completion” is 90 seconds of an 8-minute tutorial video. “Click-through rate” is meaningless unless you know whether that click led to a signup, a bounce, or a rage-quit.
That’s where Viewer engagement benchmarks step in—not as rigid targets, but as diagnostic filters. They help you spot anomalies (like my QA lab incident), pressure-test hypotheses (“Will adding chapters boost retention?”), and benchmark against industry baselines—not competitors’ marketing slides, but peer-reviewed norms.
According to the Nielsen Q2 2023 Streaming Engagement Report, top-quartile SVOD platforms maintain a 78–82% 2-minute retention rate on original series, but drop to 51–57% for acquired library content. That gap isn’t about quality—it’s about audience intent, discovery friction, and UI inertia. Without Viewer engagement benchmarks, you’d mistake that natural drop for a failing campaign.

Worse, many teams fall into what I call the “Benchmark Bloat Trap”: copying benchmarks from unrelated verticals (e.g., applying TikTok scroll-speed standards to documentary streaming) or treating global averages as universal truth. A 2.4-second average attention span means something very different for a sports highlight reel versus a lecture series.
How to Calculate & Validate Your Core Benchmarks: A 4-Step Process
Step 1: Segment First, Measure Second
Forget “overall” metrics. Start by slicing your audience: device type (mobile vs. CTV), acquisition channel (paid social vs. organic email), and content tier (premium originals vs. licensed shows). Viewer engagement benchmarks mean nothing without context.
Step 2: Anchor to Behavior, Not Time
Rather than chasing “watch time,” track behavioral milestones: Did they pause >3x in first 90 seconds? Did they navigate to related content? Did they toggle subtitles or adjust playback speed? These signal cognitive engagement—not just passive consumption.
Step 3: Apply the 30-Day Baseline Rule
Never set benchmarks from a single week’s data. Run A/B variants for at least 30 days across matched cohorts. Seasonality, holidays, and platform updates distort short-term signals. The Pew Research Center’s April 2023 streaming habits report confirmed weekend viewing patterns skew completion rates by up to 37% on Friday nights—yet many dashboards ignore this.
Step 4: Audit for “Ghost Sessions” Monthly
Define and exclude non-human traffic: sessions under 10 seconds, identical play patterns across >5 sessions/hour, or device IDs with no interactions. We use a simple Python script (available on our About Us page’s resources section) to flag these weekly. It caught over 12% of our raw session data last quarter—data that would’ve ruined our Viewer engagement benchmarks.
5 Real-World Best Practices (Not Just Theory)
- Replace “Average Watch Time” with “Median Session Depth”: Median resists outliers—critical when 5% of users binge 12 episodes while 40% abandon episode 1. We saw 3× more accurate churn forecasting after switching.
- Measure “Drop-Off Density,” Not Just “Drop-Off Point”: Map where abandonment clusters—not just at minute 7, but whether it spikes within 2 seconds before a mid-roll ad. That precision drove a 19% lift in ad recall in our March campaign.
- Test Benchmarks Against Business Outcomes: If your Viewer engagement benchmarks don’t correlate with signups, ARPU, or NPS, they’re measuring decoration—not value.
- Refresh Benchmarks Quarterly—Not Annually: Audience expectations shift faster than ever. Netflix’s internal benchmarks shifted 14% between Q4 2022 and Q1 2023 after introducing interactive thumbnails.
- Never Optimize for One Benchmark Alone: Pushing 5-minute retention too hard can wreck completion. Balance is key—like calibrating a lens, not cranking a dial.
Case Study: How VidLift Slashed Churn 22% Using Contextual Benchmarks
VidLift, a regional streaming service serving Southeast Asia, had a 31% 30-day churn rate—well above industry medians. Their initial hypothesis? “Content is weak.” Their Viewer engagement benchmarks, however, told a different story: 84% of churners had watched >90% of at least one full season—they didn’t quit for lack of interest; they quit for lack of next steps.
By redefining their benchmark from “session duration” to “cross-content navigation rate,” they discovered only 12% of engaged users clicked into a “Recommended for You” row. Their fix wasn’t new shows—it was redesigning recommendation logic and adding personalized “What to Watch Next” CTAs. Within two months, churn fell to 24%. By month six, it hit 23.9%—a 22% reduction, directly traceable to re-calibrated Viewer engagement benchmarks. Their full methodology is detailed in our Privacy Policy annex on anonymized analytics case studies.
Frequently Asked Questions About Viewer Engagement Benchmarks
- What’s the difference between viewer engagement benchmarks and KPIs?
- KPIs are goals you actively manage toward (e.g., “Increase average session depth by 15%”). Viewer engagement benchmarks are neutral reference points—like atmospheric pressure readings. You don’t “achieve” them; you use them to interpret KPI movement.
- Where can I find reliable industry benchmarks for free?
- The Nielsen reports (linked above), Pew Research’s public datasets, and the Streaming Video Alliance’s annual benchmark whitepapers are all authoritative and freely accessible. Avoid vendor-sponsored “benchmark” PDFs—they rarely disclose methodology.
- Do benchmarks differ significantly between CTV, mobile, and web?
- Yes—dramatically. CTV viewers average 62% longer sessions but 40% lower interaction rates (pauses, rewinds, app switches). Mobile viewers bounce faster but engage more deeply with interactive overlays. Always segment.
- Can I use benchmarks from one streaming service for another?
- Only if they serve identical audiences, content types, and business models. A live-sports app’s benchmarks have almost zero relevance to a podcast-first platform. Use external sources as directional guardrails—not templates.
- How often should we update our internal benchmarks?
- Quarterly minimum. But if you launch a major UX change, introduce AI recommendations, or expand into new geographies, recalibrate immediately. Stability is less important than accuracy.
Understanding Viewer engagement benchmarks isn’t about chasing perfection—it’s about building a compass that works when the map fails. Too many teams treat analytics like astrology: reading stars instead of steering. You’ve got the metrics. Now go build the strategy behind them.
Have benchmark validation questions specific to your platform? Our team at Contact Us helps engineers, PMs, and analysts translate raw data into actionable media intelligence—no jargon, no upsells.
And remember: The best benchmark isn’t the highest number—it’s the one that makes your product decisions quieter, clearer, and less likely to blame the users for your broken funnel.