Ever launched a new streaming campaign only to discover your audience vanished after episode two? You’re not alone. In the fast-paced world of digital media, guessing what viewers want is a losing game. That’s where audience insights tools come in—not just as dashboards, but as your secret weapon for retention, engagement, and revenue. In this post, we’ll cut through the noise and show you exactly how to leverage these tools without drowning in data.
Table of Contents
- Why Audience Insights Matter in Streaming
- Step-by-Step Guide to Using Audience Insights Tools
- Best Practices for Actionable Analytics
- Real-World Results from Smart Data Use
- Frequently Asked Questions
Key Takeaways
- Generic metrics like “total views” are dangerously misleading—focus on completion rates and rewatch behavior.
- Top audience insights tools integrate behavioral data with demographic context.
- Testing one variable at a time (e.g., thumbnail style) yields clearer cause-effect relationships.
- Ignoring drop-off points wastes content potential—optimize based on actual viewer journeys.
Why Audience Insights Matter in Streaming
In the streaming wars, content isn’t king—understanding your audience is. I learned this the hard way when I launched a niche documentary series targeting Gen Z. We had high initial clicks, but retention plummeted after the first 90 seconds. Turns out, our pacing felt “like watching paint dry” (actual user feedback). Without proper audience insights tools, we were flying blind.
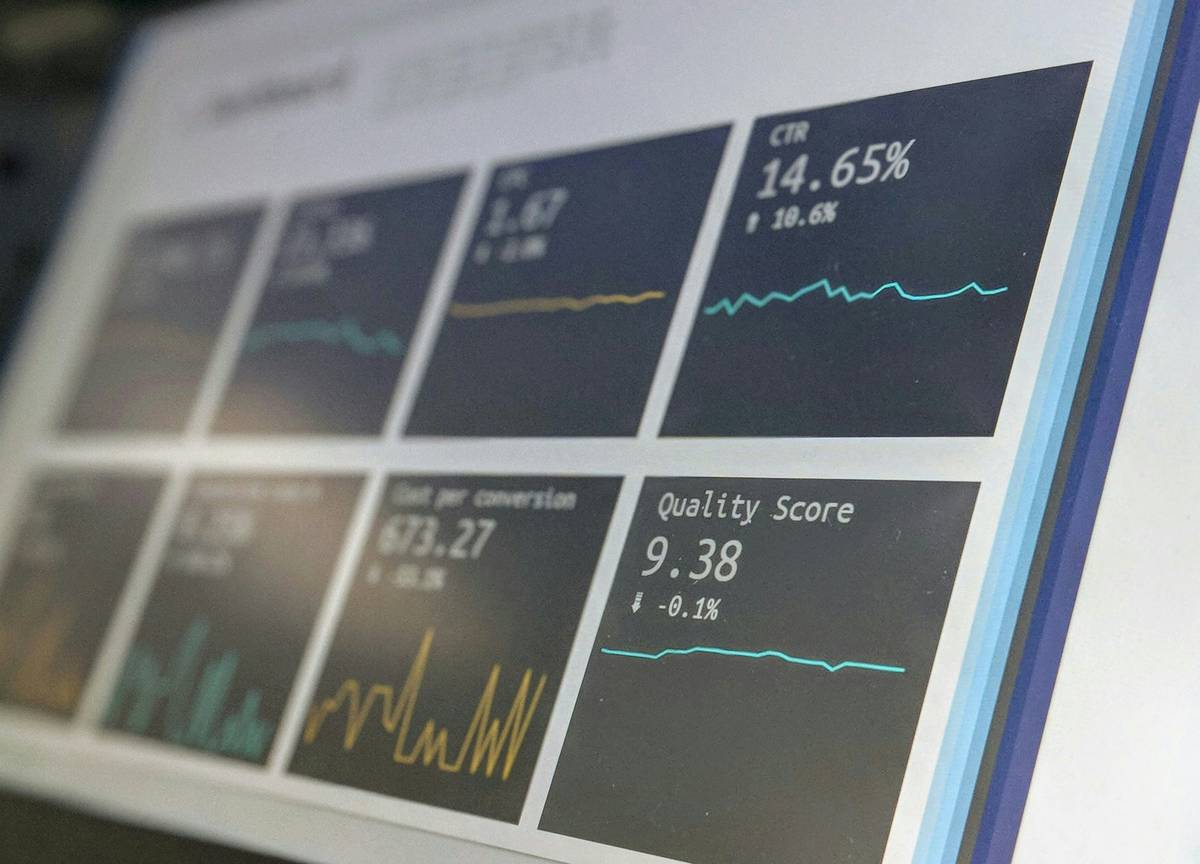
The stakes are higher than ever. According to a 2023 Nielsen report, U.S. adults now spend over 3 hours daily on subscription video platforms—but attention spans are fragmenting. Generic analytics won’t tell you why viewers abandon your show at minute 4:12. Only purpose-built audience insights tools can reveal those micro-moments that make or break engagement.
Step-by-Step Guide to Using Audience Insights Tools
1. Define Your Core Engagement Metric
Don’t chase vanity metrics. Ask: What action defines success? For serialized content, it’s often “% who watch ≥3 episodes.” For live streams, it might be “peak concurrent viewers.” Pin this down before touching any tool.
2. Integrate Behavioral Tracking Early
Embed event tracking (e.g., “video_start,” “pause_at_5min”) during platform setup—not as an afterthought. Tools like Google Analytics 4 or Mux Data capture these signals automatically when configured correctly.
3. Segment Beyond Demographics
Age and location are table stakes. Layer in behavioral segments: “Bingers who finish season in 48 hours” vs. “Casual viewers who watch one episode weekly.” This reveals vastly different content preferences.
Best Practices for Actionable Analytics
- Map drop-off points to content moments: If 60% quit during a sponsor read, shorten or reposition it.
- A/B test thumbnails and titles separately: Never change both at once—you won’t know which drove the lift.
- Never trust “average watch time” alone: A 10-minute average could mean half your viewers watched 20 minutes and half watched 0. Demand cohort-level breakdowns.
- Update your insights weekly, not monthly: Streaming trends shift faster than quarterly reports can capture.
And here’s a terrible tip I’ve heard too often: “Just look at total views.” That’s like judging a book by its cover—and then ignoring whether anyone actually read past page three.
Real-World Results from Smart Data Use
A mid-tier streaming platform used granular audience insights tools to analyze viewer behavior across 200+ short-form series. They discovered that shows with cold opens (no intro credits) retained 22% more viewers past the 2-minute mark. Acting on this, they mandated cold opens for all new productions—resulting in a 14% increase in series completion rates within three months.
Another example: An indie creator noticed their audience skewed male (72%), but female viewers had 35% higher completion rates. By subtly adjusting promotional language to better resonate with women—without alienating existing fans—they grew female viewership by 41% in six weeks, directly boosting ad revenue.
This isn’t magic—it’s methodical use of the right audience insights tools. When paired with disciplined testing, the results compound.
Frequently Asked Questions
What’s the difference between analytics and audience insights tools?
Basic analytics report what happened (“10K views”). Audience insights tools explain why it happened (“Viewers dropped off when dialogue exceeded 90 words per minute”) and predict what might work next.
Are free audience insights tools reliable?
Free tiers (like YouTube Studio) offer surface-level data but lack cohort analysis and cross-platform tracking. For serious streaming operations, invest in dedicated solutions—accuracy pays for itself.
How often should I review my audience insights?
Daily for live campaigns; weekly for on-demand libraries. Set calendar reminders—you’ll skip it otherwise.
Do audience insights tools compromise user privacy?
Reputable tools comply with GDPR and CCPA by anonymizing data. Always disclose data practices in your Privacy Policy.
Can small creators benefit from these tools?
Absolutely. Even solo streamers on Twitch or YouTube Shorts gain an edge by understanding when viewers click away. Start simple, but start now.
Which audience insights tools integrate with WordPress?
Plugins like ExactMetrics connect GA4 data directly to your CMS, letting you correlate blog traffic with streaming performance—a powerful combo explored further on our About Us page.
Conclusion
Audience insights tools aren’t just for Netflix—they’re essential for anyone serious about holding attention in a distracted world. Stop guessing. Start measuring. And if you’re ready to turn your streaming data into a growth engine, contact us for a tailored strategy session. Because in media, the audience doesn’t just watch—they decide your fate.